VMware Fusion 8 Benchmarks vs. Fusion 7 and Boot Camp

Hardware, Software, and Testing Methodology
Our test hardware for the following Fusion 8 benchmarks is the same as we used for our Parallels 11 benchmarks. Tests were performed on a Mid-2014 15-inch MacBook Pro with a 2.5GHz Intel Core i7-4870HQ, 16GB of RAM, 2GB NVIDIA GeForce GT 750M GPU, and a 512GB PCIe flash storage drive.
Even though Fusion 8 supports OS X El Capitan, we’re reluctant to perform tests on beta software. We therefore used OS X Yosemite 10.10.5, the latest publicly available version as of the date of our tests, as our host operating system. We’ll revisit El Capitan once it launches later this year and we’ll let you know if it provides any performance boosts that would alter our Fusion 8 benchmark results.
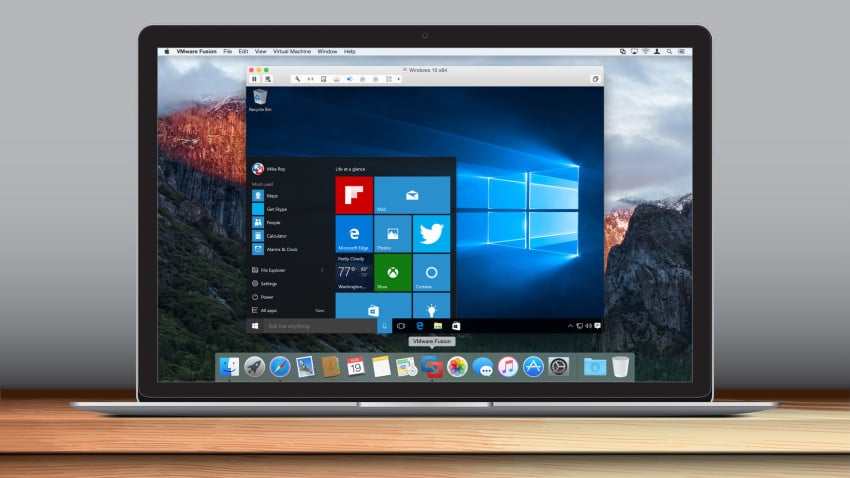
Our guest operating system for all tests is Windows 10 Pro 64-bit, which was installed separately in three configurations: native to the Mac’s hardware via Boot Camp, in a virtual machine powered by Fusion 7, and in a virtual machine powered by Fusion 8.
Regarding our choice to use the 64-bit version of Windows, it’s true that the 32-bit version can be easier to virtualize and therefore may offer slightly better performance in certain circumstances. Unfortunately, the latest version of Boot Camp requires the use of a 64-bit version of Windows, so we elected to use the 64-bit version in our virtual machines as well for the sake of consistency.
Each of our Windows 10 virtual machines was configured for maximum performance, with 8 assigned virtual CPUs, 12GB of RAM (the maximum recommended amount in order to ensure that enough is reserved for OS X), and 1GB of graphics memory configured for Fusion 8’s DirectX 10 and OpenGL 3.3 drivers. All features that could possibly impact performance, such as error logging or an expanding virtual disk, were disabled, and the VM was configured for maximum performance in the Fusion 8 settings.
All operating systems and testing software were updated to their most recent versions as of the date of this article. More information about each benchmark application or test can be found on its respective results page.
As is standard practice here at TekRevue, all tests, unless otherwise noted in the results, were performed three times for each Windows installation, and the results were averaged. Our normal procedure in the event of a discrepancy greater than 5 percent is to re-run the tests until the issue can be identified. That was not necessary for these tests, however, as all results from each iteration were within the acceptable range of deviation.
You can browse the results of each test in order by clicking the “Next” or “Previous” buttons, below, or you can jump directly to a specific test by selecting it from the Table of Contents. We had to pack a lot of information into the charts on the following pages, and they may be difficult to read when viewed on small screens. If you have trouble reading the data, you can access a full size version of any chart by clicking or tapping on it.
Table of Contents
[one_half padding=”0 5px 20px 0″]
1. Introduction
2. Fusion 8 New Features & Overview
3. Hardware, Software, and Testing Methodology
4. Geekbench
5. 3DMark (2013)
6. 3DMark06
7. FurMark OpenGL Benchmark
8. Cinebench R15
[/one_half]
[one_half_last padding=”0 0px 20px 5px”]
9. PCMark 8
10. Passmark PerformanceTest 8.0
11. x264 Encoding
12. x265 Encoding
13. File Transfers
14. Virtual Machine Management
15. Conclusions
[/one_half_last]






2 thoughts on “VMware Fusion 8 Benchmarks vs. Fusion 7 and Boot Camp”