How to Fix Charts Greyed Out in Excel
Spreadsheets organize and analyze data. Charts bring that data to life. Put these two together, and you’re looking at a match made in heaven. That’s why it can be frustrating to suddenly lose the ability to create or edit charts in Excel. If your chart options have become unusable, you’ve come to the right place. This guide will teach you how to fix charts greyed out in Excel.
How to Fix Charts Greyed Out in Excel: 5 Simple Solutions
Selecting the data. Clicking on “Insert.” Choosing the best chart type. These three simple steps are all you need to create a chart in Excel. Here’s what to do if the third step suddenly becomes impossible to achieve.
Solution 1 – Exit the Cell
Sometimes, you may stress out about a problem without realizing it has a super-simple solution. This might be one of those situations. You see, you can’t insert a chart while you’re typing in a cell. This automatically greys out all the “Insert” options.
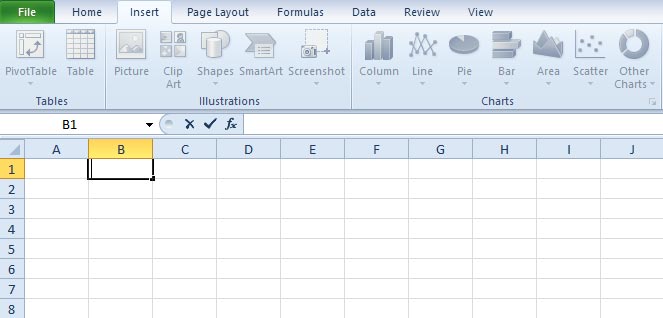
So, before looking into the more “complex” solutions, check if you’re currently editing cell content.
If you are, the solution is as simple as the problem itself. Just exit the cell. You can do so by clicking anywhere else in your workbook or pressing the “Esc” key on your keyboard.
Solution 2 – Tweak Your Display Options
Various elements are considered to be objects in Excel. The worksheet, the cell, the range. Any chart created within the workbook is also considered an object. So, if some objects are hidden in your workbook, you might not be able to work with charts. Here’s how to fix this issue.
Step 1: Click on the “File” tab in the upper-left corner.
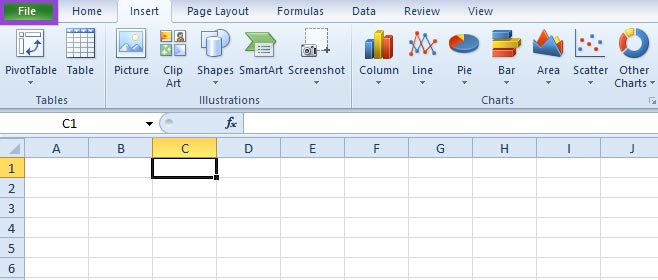
Step 2: Go to “Options.”

Step 3: Select the “Advanced” tab on the right side panel.
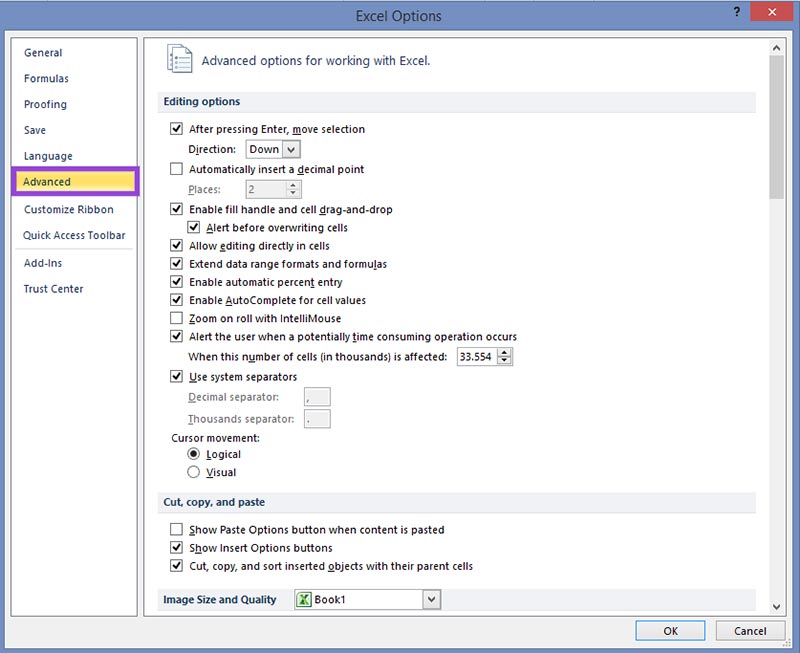
Step 4: Scroll down to the “Display options for this workbook” section.
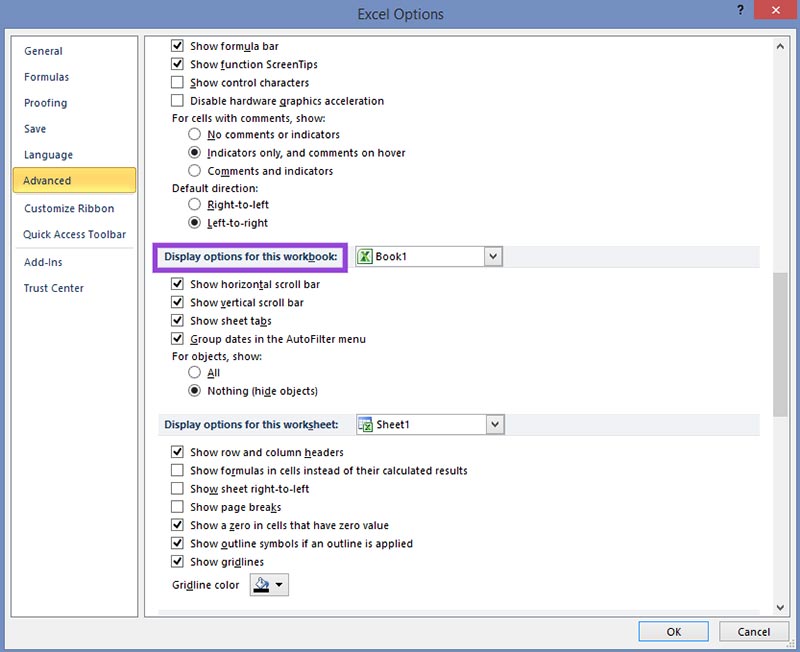
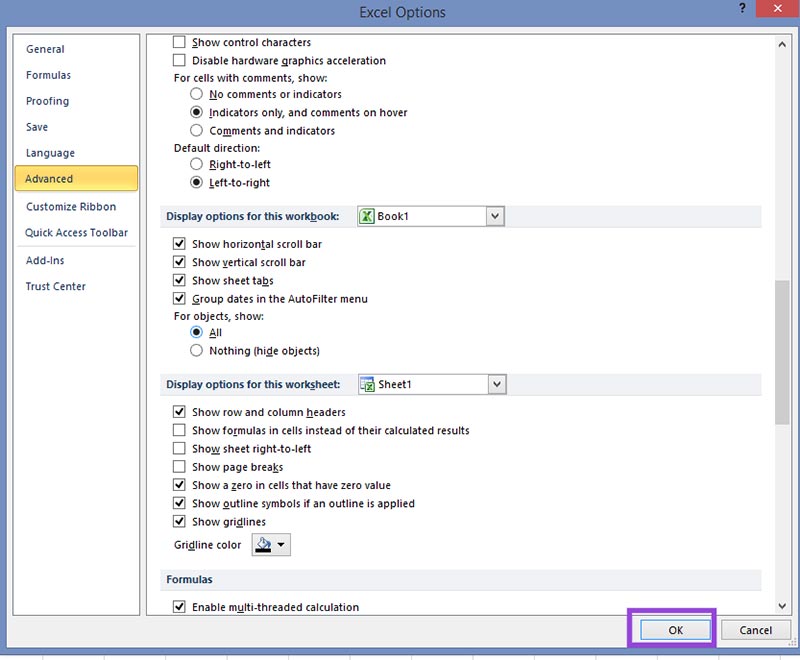
Step 5: Under the “For objects, show” option, check the box for “All.”

Step 6: Click “OK” in the bottom-right corner of the Excel Options pop-up window to confirm your selection.
Solution 3 – Turn Off the Shared Workbook Feature
The Shared Workbook feature allows multiple people to work on the same workbook. However, this is an older feature, which might explain its numerous limitations. One of these limitations might prevent you from inserting charts into the workbook. To enable your chart options, all you need to do is disable this feature. Here’s how.
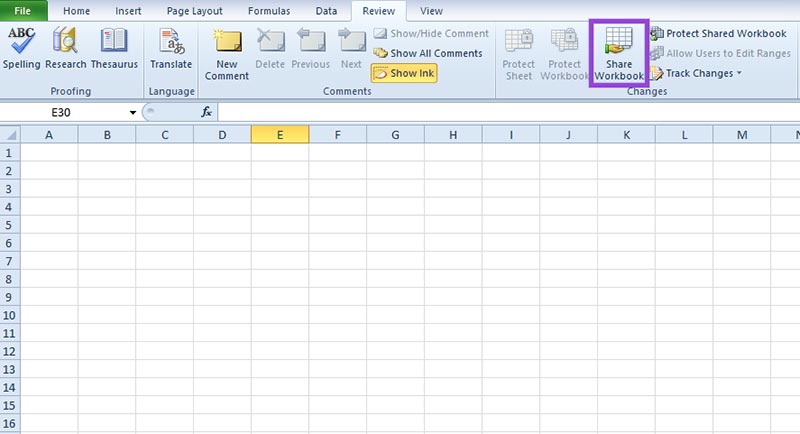
Step 1: Navigate to the “Review” tab at the top of your workbook.
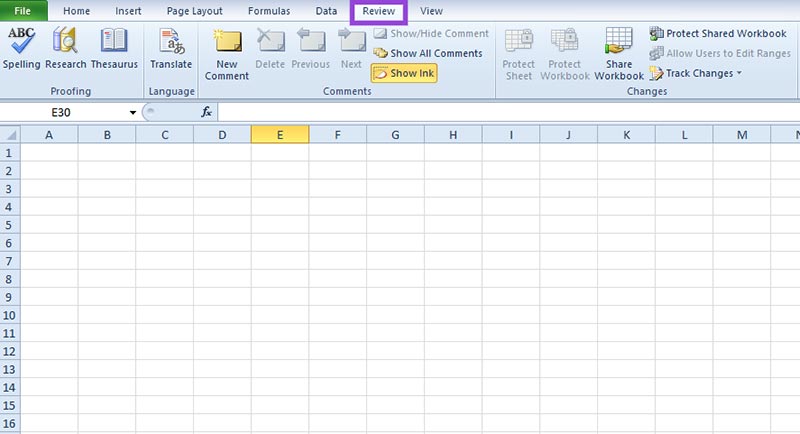
Step 2: Click on the “Share Workbook” button in the “Changes” group.
Step 3: Uncheck the box next to “Allow changes by more than one user at the same time.”
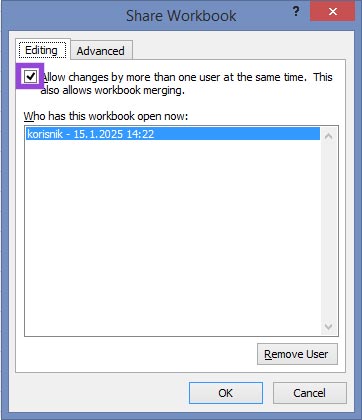
You should only turn off this feature if you’re the only person using the workbook currently. Otherwise, you risk losing any ongoing work.
Step 4: Click “OK” to save the changes.
Solution 4 – Unprotect the Sheet
Protected sheets and workbooks require passwords to be accessed or edited. This is usually done to protect sensitive data and prevent unauthorized changes. That’s why your chart options might be greyed out in a protected sheet – you simply don’t have permission to use them. The solution is to unprotect the sheet. Yes, that’s the verb Excel uses. To do this, you’ll need the workbook’s password. Then, follow these steps:
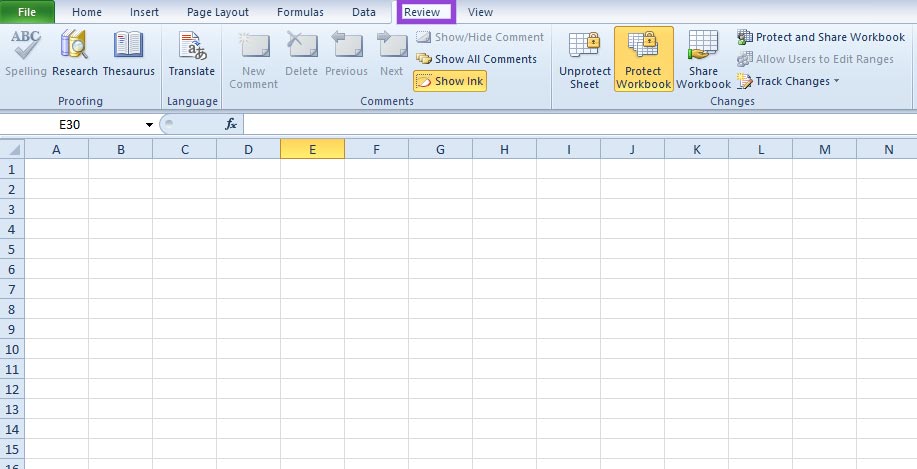
Step 1: Visit the “Review” tab.
Step 2: Click on the “Unprotect Sheet.”
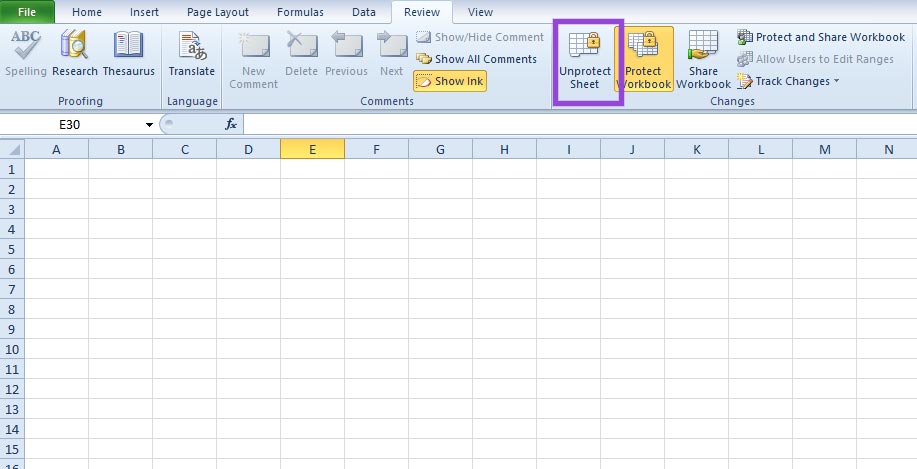
Step 3: Enter the password for the sheet and hit “OK.”
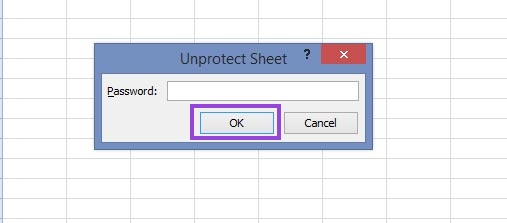
If you don’t know this password, you’ll have to ask the workbook’s owner. You can find out who the owner is in three simple steps.
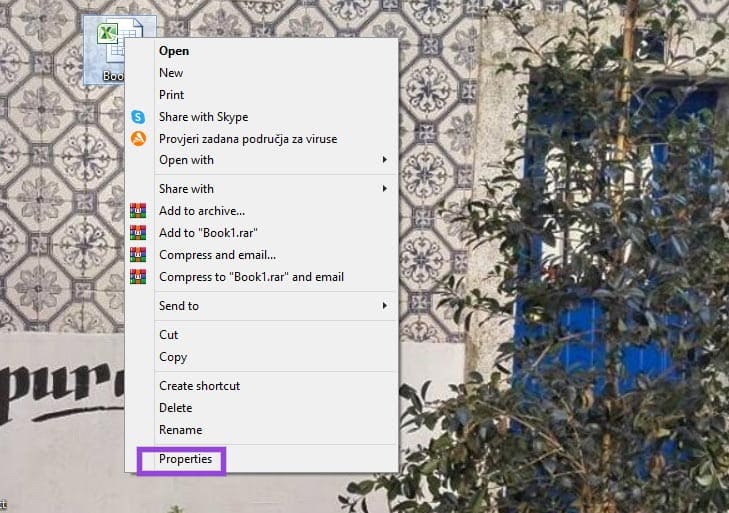
Step 1: Right-click on the protected workbook.
Step 2: Select the “Properties” option at the bottom of the dropdown menu.
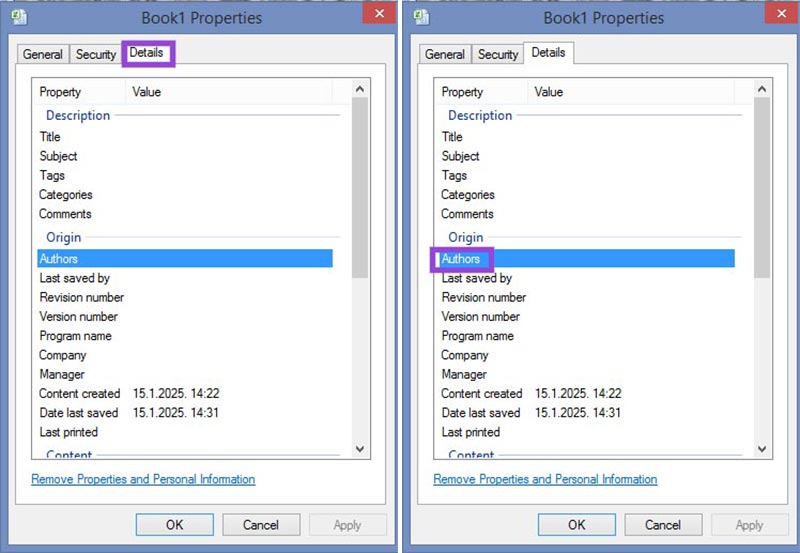
Step 3: Head to the “Details” tab and check under “Authors.”
Solution 5 – Start Again
If nothing works, you can simply give up. Give up on that specific workbook, that is. Just copy all the tabs from it into a new workbook. Starting fresh might just be what you need to bring the color back to your chart options.


