Explore Your Network With Wireshark
What is Wireshark?
Wireshark is a powerful network analysis tool that allows you to monitor and capture network traffic. It captures traffic at a packet level, meaning that you can see each bit of information that gets passed around your network, what it contains, and where it’s going.
This tool lets you visualize and understand the flow of traffic within a network. By seeing what data is being passed around, you can also gain insight into any potential security concerns that you might face as well as any potentially unwanted traffic, like malware, programs hogging bandwidth, and even unwanted guests on your WiFi.
Wireshark is also an important tool because it allows you to see exactly how data leaving your network gets sent into the greater Internet. For example, you can see and read HTTP requests, allowing you to see which data is being sent out unencrypted. That could be a very big deal, especially if that data is something like a bank password.
Installing Wireshark
Wireshark is open source and cross platform. It’s available free of charge and for every major operating system. The controls within the program are exactly the same across all platforms, so there’s no need to worry. The images in this article are from Linux, but everything that you’ll see will work on Windows and Mac too.
Windows
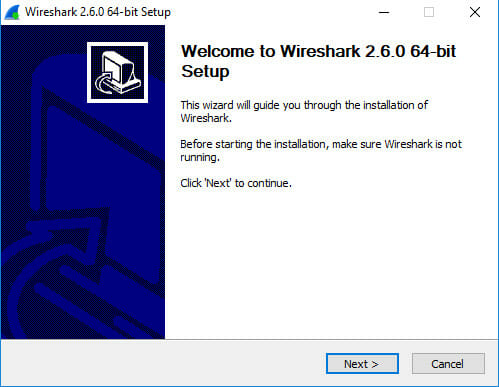
Go to the Wireshark download page, and download the latest release for your version of Windows. Run the resulting .exe. The installer is fairly standard. You can click through most of it and use the defaults.
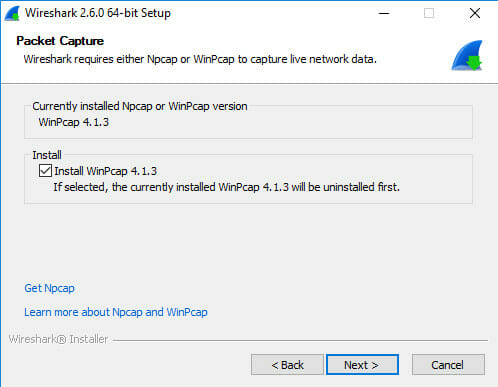
There is one thing that you want to look out for, though. A screen will come up asking you if you want to install WinPcap. WinPcap is an additional utility for Wireshark on Windows that allows it to capture all traffic on a network, rather than just your computer’s traffic. Check off the box to install WinPcap. It will also ask you about the USB version. That’s not necessary, but you can include it too.
After that, the installation will complete. A new installation will start up for WinPcap. The defaults are acceptable there too.
Mac
Go to the Wireshark download page, and grab the latest .dmg file. When it finishes downloading, double click on the file to open it. Drag the open application into your /Applications folder to install Wireshark.
Linux
Most Linux distributions have Wireshark available in their repositories. Install it with your package manager.
$ sudo apt install wireshark-gtk
Depending on your distribution, you’ll be prompted whether you want to allow regular users to capture packets. You should say “Yes.” After the package is installed, add your user the Wireshark group. Log out and log back in, when you’re done.
$ sudo gpasswd -a user wireshark
The Interface
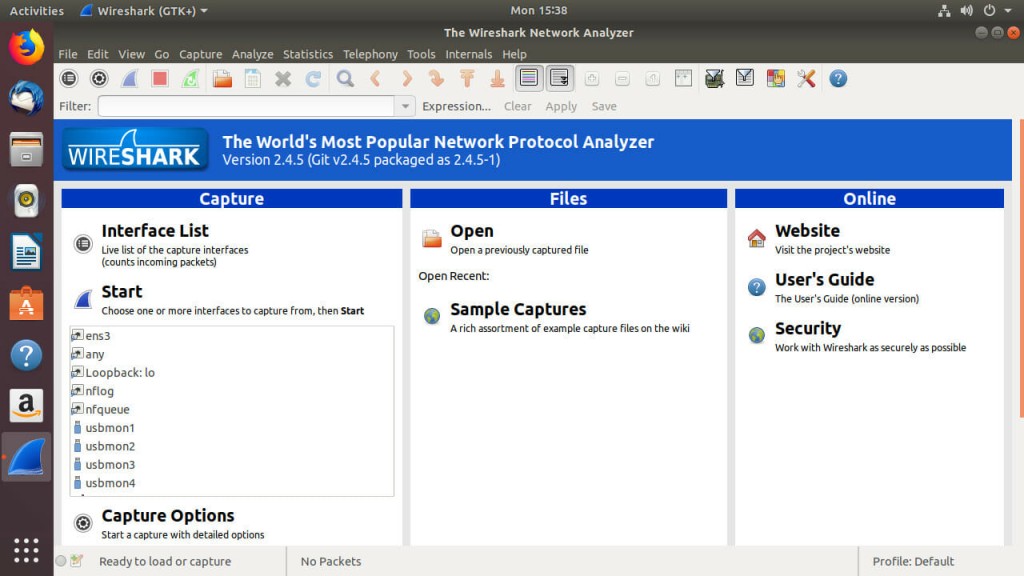
When you first open up Wireshark, you’ll see a screen similar to the one above. There are quite a few buttons above in the toolbars, and it can look overwhelming, but it’s much simpler than you probably think.
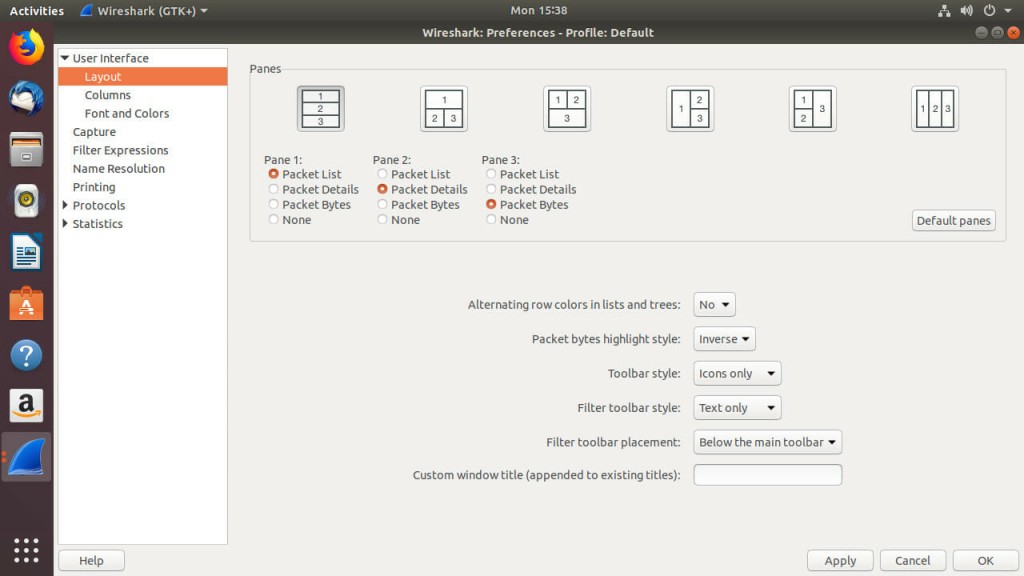
The default capture interface is kind of awkward. You can change the layout to make it more comfortable, click on “Edit.” Find the “Preferences” menu and the bottom, and open it. Under the preferences, you’ll see a “Layout” tab to the left. Select it. You’ll see several icons depicting different layout options. Choose the one that looks best to you. The first option with the stacked layout usually works well.
Don’t worry too much about the toolbars yet. The first five icons are the most important. In order, they let you select an interface to capture on, change the capture settings, start a capture, stop a capture, and resume one. The icons themselves are fairly intuitive.
Capture Options
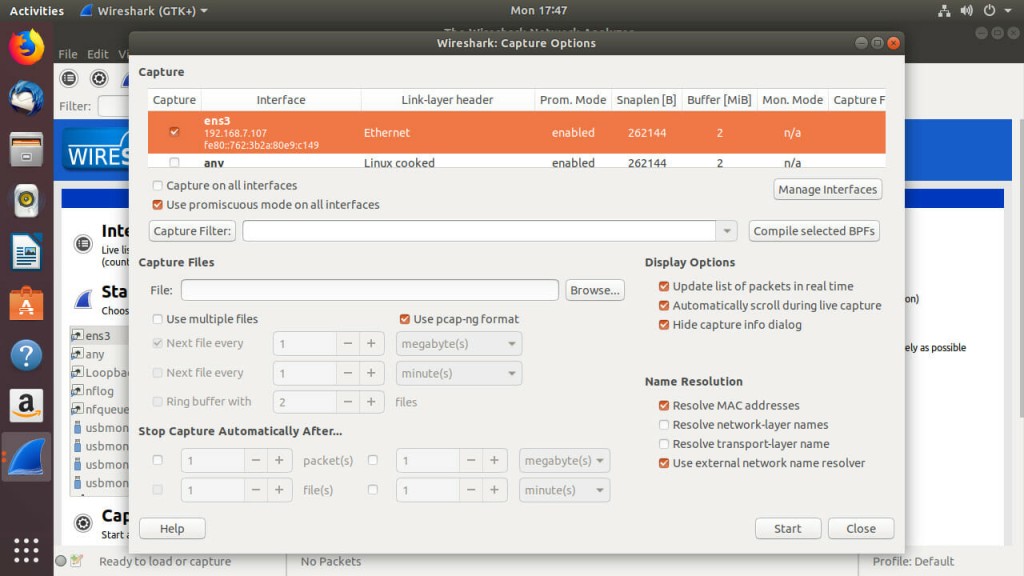
Before you start capturing traffic, you should explore the capture options to see what Wireshark can do. Click on the capture options icon. It should look like a gear.
The first thing that you’ll see at the top of the window is a table listing all of your network interfaces. Check the box next to the interface that you want to capture on. In most cases, the interface that you want is the one you’re using to connect to the network. It’ll be the one that corresponds to your Ethernet port or WiFi device.
Below that, you’ll see a couple of checkboxes. One will ask if you want to use promiscuous mode. Promiscuous mode is what allows you to see the exchanges between all devices on a network, not just your own computer. Chances are, you want this enabled. Be careful, though. Using promiscuous mode on a network that you don’t own or have permission to test is illegal.
The next section down covers capture files. Wireshark lets you save your captured data. The first field there lets you specify a single destination for your capture. Below that, you can check the box to enable Wireshark to break up the capture log. Logs can get very large, especially on bigger networks. This feature lets you break up your capture data automatically based either on time or file size. Either way, it’s a convenient feature when you’re dealing with long term scans or a busy network.
Below that, you can control the duration of your capture. Again, captures can get big, so you can set a maximum size. You can also time it out, which is nice because it lets you take a snapshot of a specific time frame on your network.
Capture Traffic
Once you have your settings in order, you can start capturing the traffic on your network. If you’ve never done this sort of thing before, be prepared to be surprised. There’s much more traffic than you know flowing around your network. To start the capture, either click on the “Start” button at the bottom of the configuration window or the shark fin icon. Either way works.
When you start recording, the amount of traffic that you see is dependent on which devices are on your network. While most people won’t be able to keep up with the load of traffic they see, it’s entirely possible that you see next to nothing. If that’s the case, open up a web browser and start navigating around. Your capture will quickly start to populate.
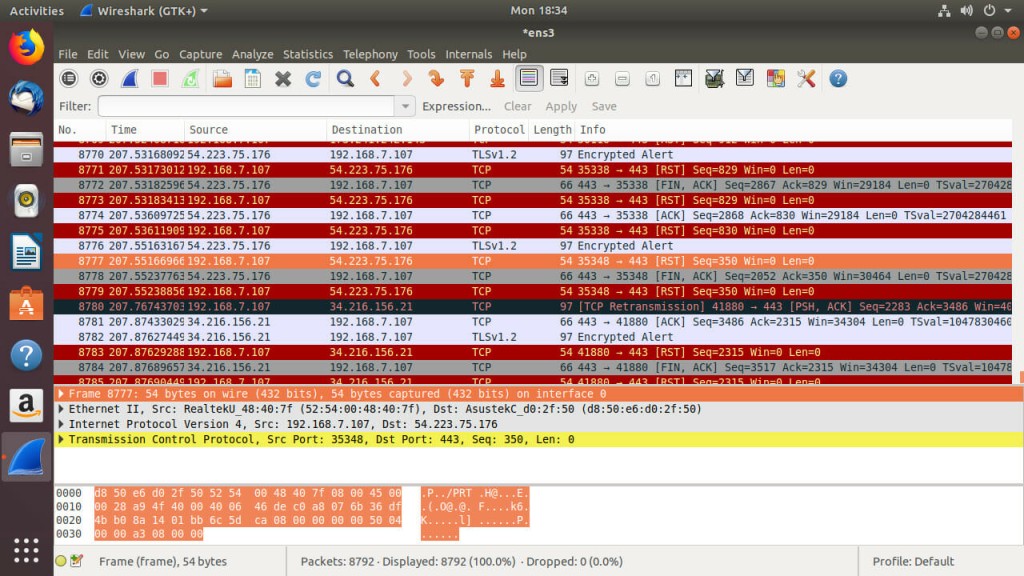
After your capture has run for as much time as you want to test with, click on the stop button in the toolbar. What you have should look something like the image above.
Reading the Data
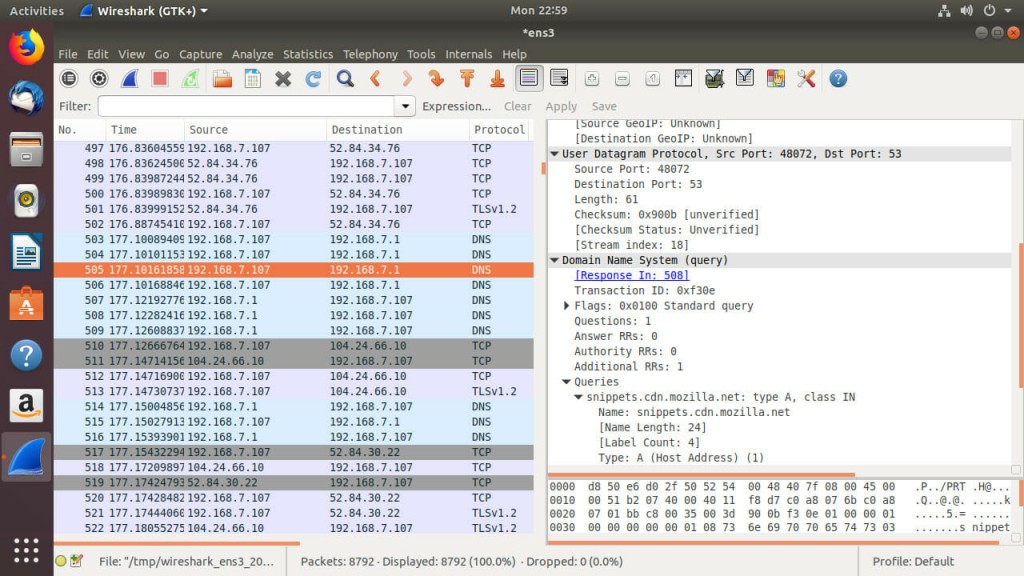
Click on one of the packets that you captured. Try to find an HTTP request. They tend to be easier to read. When you select a packet, the other two sections of the screen fill up with information about the one that you picked.
The section that you need to pay attention to has stacked collapsible tabs. Those tabs follow the OSI model and are ordered from lowest level to highest with the lowest level information at the top. That means that the information most relevant to you is probably in the bottom tabs.
Each tab contains different information about the packet. In HTTP packets, you’ll see information about the HTTP request, including the response, headers, and possibly even some HTML. Other types of packets may contain information about which ports are in use, encryption being used, protocols, and MAC addresses.
Filtering Packets
It can be a pain digging through loads of capture data to find exactly what you’re looking for. It’s inefficient, and it’s a huge waste of time. Wireshark has filtering functionality that allows you to quickly sort through packets to find exactly what’s relevant at any given time.
There are a few basic ways that Wireshark allows you to filter results. First, it has plenty of built in filters. When you start typing in one of the filter fields, Wireshark will display them as suggestions to autocomplete. If any of those are what you’re looking for, great! Filtering will be very easy.
Wireshark also uses what are called Boolean operators. Boolean operators are used to evaluate if a statement is true or not. For example, when you want two conditions met, you’d use the “and” operator between them because condition 1 and condition 2 both need to be true. The “or” operator is similar, only it just requires one of your conditions to be true. You can probably guess that the “not” operator looks for when a condition doesn’t exist.
In addition to the Boolean operators, Wireshark supports comparison operators. As the name suggests, comparison operators compare two or more conditions. They evaluate the equivalency of conditions as greater than, less than, or equal to.
Filtering During Capture
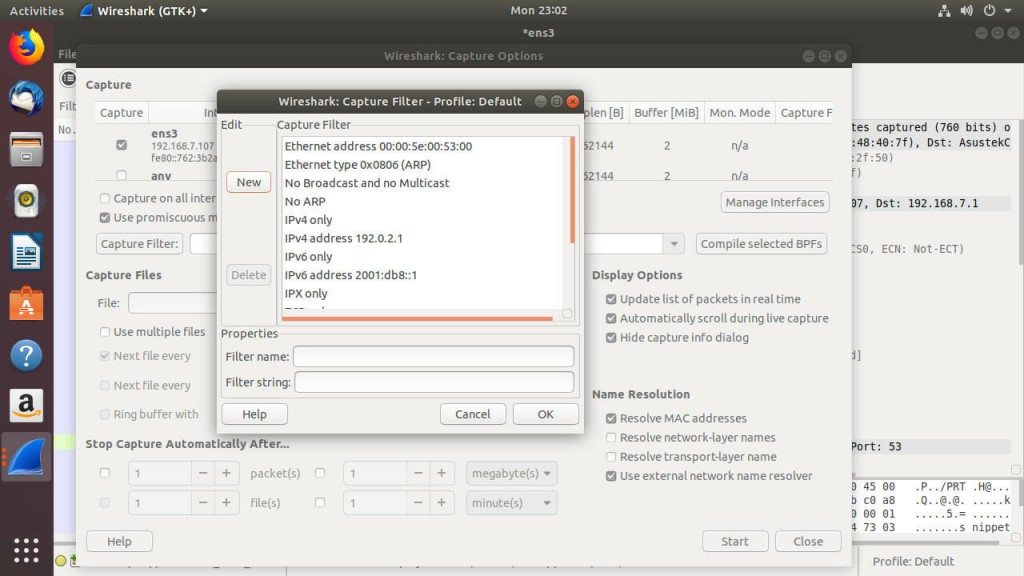
Filtering your results during the capture is very easy. Open back up the capture options. Look for the “Capture Options” button towards the middle of the window. There should also be a large text field next to it.
You can construct your filter from scratch in that field, or you can click the button and use Wireshark’s built-in filters. Try clicking on the button. A new window will open up with a list of filters. Clicking on those filters populates the fields below. The bottom field is the actual filter that’s being used. You can modify that filter as the basis of your own more custom filters. When you’re ready, click “Ok.” Then, run your scan like you normally would. Instead of capturing everything, Wireshark will only capture packets that meed the conditions of your filter. This makes sorting and categorizing your packet data much easier. You don’t need to dig through lots of extra information to find what you need.
Filtering Results
If you did a full capture or a more robust capture, but you want to filter through it after the fact, you can do that too. After you perform a capture, you’ll see an additional toolbar below the control icons. That toolbar features a “Filter” field. You can type expressions into that filed to filter which results Wireshark displays.
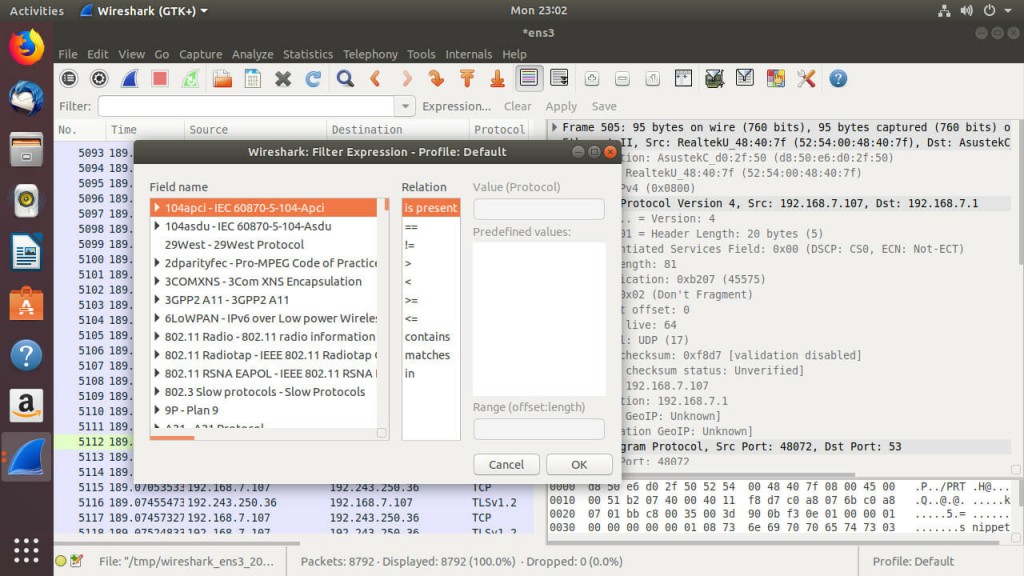
Like with filtering during capture, there’s an easy way. Click on the “Expression” button to open a window that helps you put together your filter expressions. The left column contains a list of fields. Those fields let you choose what information you’re going to target. The next column contains a list of possible relations. Most are the symbols for less than, greater than, equal to, and combinations of those. The final column is for values. These are the values that you are comparing to. Depending on your field, you can choose or write in the value that you want to compare to.
These can get more complex, and you can add more expressions together. That falls on the Boolean operators. These Booleans are different, though. This expression field uses the symbols for and, or, and not instead of the words themselves. || stands for “or.” && is “and.” A simple ! is “not.”
For example, if you want everything but UDP, use !udp. If you want HTTP or TCP, try http || tcp. You can combine them too into more complex expressions. The more complex your expression gets, the more refined your filter will be.
Following Packet Streams
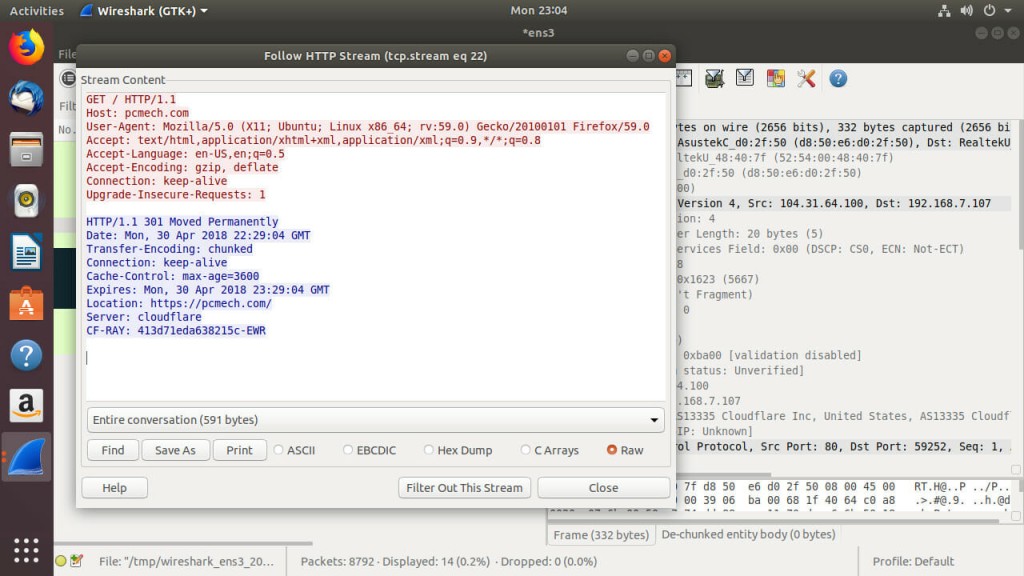
Once you have a packet or packets that interest you, you can use an awesome built in tool in Wireshark to follow the entire “conversation” between the two computers exchanging those packets. Following packet streams lets Wirshark put it all together and form a larger resulting picture. In the case of HTTP packets, Wireshark will likely put together the HTML source of a web page. With certain unencrypted VOIP programs, Wireshark can even retrieve the audio exchanged. Yes, it can actually listen in to VOIP conversations.
Right click on a packet that you want to follow. Select “Follow … Stream,” with the dots replaced by the protocol of the packet. Wireshark will take a few seconds to stitch it all together. After it finishes, Wireshark will present you with the completed result. This feature makes it much easier to see exactly what’s being exchanged over your network. It also demonstrates just how important network encryption is, since this feature will only put together total nonsense with encrypted packets.
Closing Thoughts
Wireshark is an absolutely awesome tool in network analysis. It gives you access to see everything that goes on on your network. With Wireshark, you can gain a greater understanding of where the problems with your network lie, both in terms of speed and security. Remember to always use Wireshark with care, and understand that it is very intrusive. Don’t spy on people, and remember to keep your Wireshark use within the law.


