How To Make or Add a Flow Chart to a Google Doc
Google Docs is a free online alternative to Microsoft Office. You can use it the same way you would use Word, Excel, and other Office tools, but all of your documents will be saved to your Google Drive. You can access them from any device at any time in the future. Let’s take a look at how you can use Google Docs to create flow charts for your presentations.
Creating Flow Charts in Google Docs
There are at least two different methods you can use to create flow charts in Google Docs. One requires you to create every bubble manually, and the other one is done automatically by a paid add-on called Lucidchart. This software is perfect for people who have to generate many flow charts daily because it does most of the work for you. Let’s start with the manual method first.
Method 1 – Create the Charts Manually
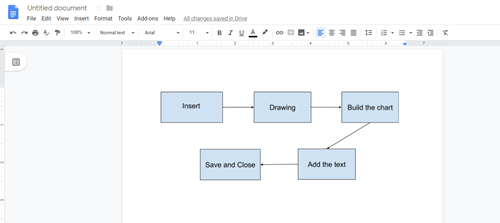
Google Docs comes with a native app called Google Drawings. You can use it to draw all kinds of shapes or objects, and it’s perfect for creating flow charts. Here is what you need to do:
- Open Google Docs, and create a new blank file.
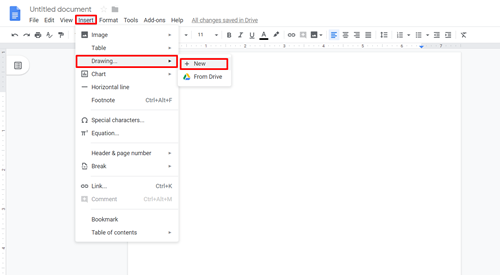
- Select the “Insert” tab and then hover your mouse over “Drawing,” and select “+New.”

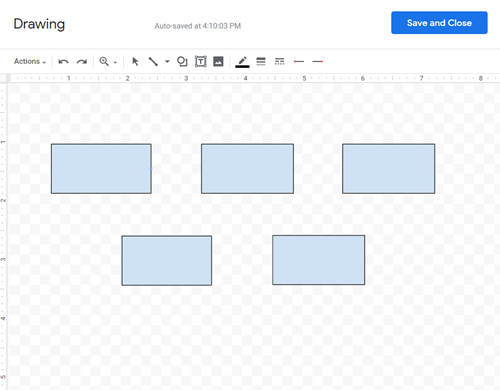
- A new window will pop up. Click on the “shape” icon and choose an object to add to your flow chart.

- Repeat the process for every individual object you want to add to your flow chart. You can copy-paste the shapes you draw to make sure every part of your flow chart is the same size.

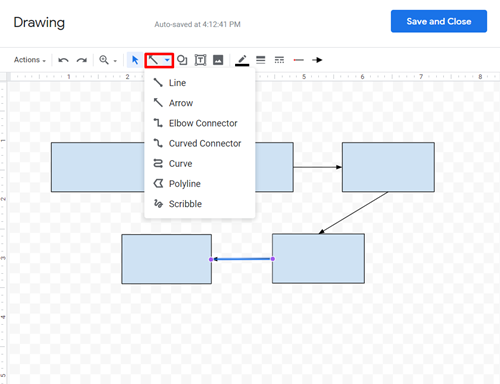
- When you insert and place all of the objects, choose one of the available lines, curves, or arrows to connect the objects.

- Add text to your flow chart if needed. You can also use many available tools to customize your flow chart further.

- Click “Save and Close” to see the chart in your Google document.
- You can edit the flow chart at any time by double-clicking on it.
As you can see, it’s easy to create a flow chart in Google Docs, but things can get more complicated if you need to draw a sprawling, complex flow chart with hundreds of elements.
The Downsides of Creating Flow Charts in Google Drawings
Apart from being time-consuming, using Google Drawings to create flow charts has some other drawbacks.
- You need to edit each shape individually.
- Unless you position them just right, the arrows may give your flow chart an unpolished feel.
- You need to click at least three times to draw lines (which will often be uneven).
- If you’re not happy with the shapes offered in the library, it can get complicated to use shapes from other sources.
- There is no way to save the flow charts as stand-alone documents. You can copy them to other docs, but you can’t save them to Sheets or slides.
Now, let’s take a look at an add-on you can use instead.
Method 2 – Create Flow Charts Using Lucidchart
It’s worth buying Lucidchart if you spend a great deal of time creating flow charts in Google Docs. It’s a simple add-on that can help you get a lot done much faster. Because you can use formatting commands, your charts will also look more professional, and all of the elements will be even. Here are some of the advantages of using this add-on:

- You can draw shapes and connect them with lines without returning to the toolbox every time.
- The diagrams you create are saved as stand-alone documents you can use in the future, which saves you a great deal of time.
- You can find many shapes and charts that are unavailable in Google Docs.
- There are more options that will help you make your charts unique.
The only significant downside is the price.
Create Some Impressive Flow Charts Today
No matter if you want to go with the first or the second method, Google Docs can help you create some great-looking flow charts for professional or personal use. The first method works fine if you don’t make flow charts that often, but it’s very time-consuming, especially if you need to create large charts. The second method can help you get a lot done quicker, and it also provides better results. But you have to pay to use the Lucidchart add-on, so it’s up to you to decide if it’s worth the investment.
Now you know how to use Google Docs to create flow charts. Have you ever used Lucidchart to create flow charts, or do you prefer the manual method? Tell us about your flow chart expertise in the comment section below.


