VMware Fusion 8 Benchmarks vs. Fusion 7 and Boot Camp
Geekbench
We’ll begin our Fusion 8 benchmarks with the popular cross-platform benchmarking tool, Geekbench. Available for virtually every modern computing platform — Windows, OS X, Linux, Android, and iOS — Geekbench aims to provide universally comparable scores of relative performance across multiple device types. It’s important to note, however, that Geekbench tests only a device’s CPU and memory performance, and doesn’t look at other important areas such as graphics or storage.
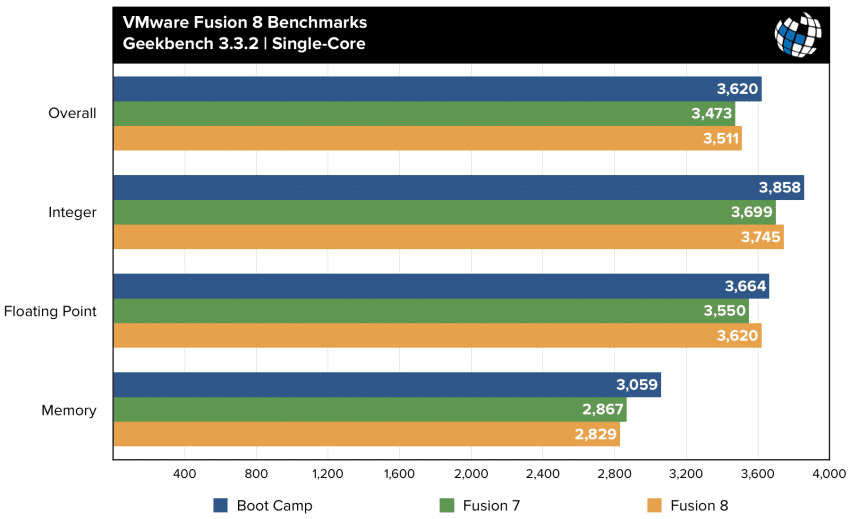
We ran the 64-bit benchmark test three times on each Windows installation using Geekbench 3.3.2, the latest version as of the date of publication. Geekbench reports two sets of results: one for single-core performance and one for multi-core performance. We’ll start with single-core results, below:
With the exception of a negligible difference in memory performance, Fusion 8 offers modest single-core CPU improvements over Fusion 7. Like we saw with Parallels 11 last week, CPU-based tasks are very close to native performance, with Fusion 8 trailing Boot Camp by only about 3 percent in processor calculations, and by 7.5 percent in memory speed.
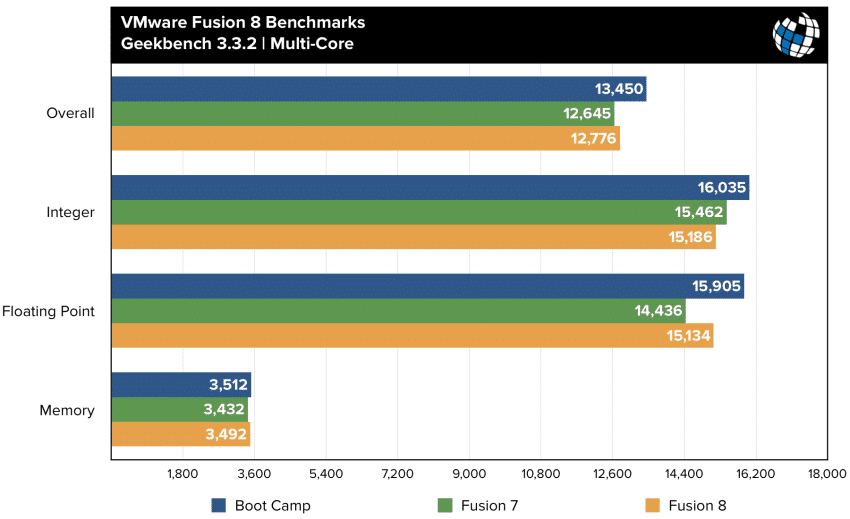
Multi-Core performance tells a similar story, with Fusion 8’s largest advantage resting in a roughly 5 percent jump in floating point performance, while both Fusion 7 and Fusion 8 show excellent near-native results when compared to Boot Camp.
Table of Contents
[one_half padding=”0 5px 20px 0″]
1. Introduction
2. Fusion 8 New Features & Overview
3. Hardware, Software, and Testing Methodology
4. Geekbench
5. 3DMark (2013)
6. 3DMark06
7. FurMark OpenGL Benchmark
8. Cinebench R15
[/one_half]
[one_half_last padding=”0 0px 20px 5px”]
9. PCMark 8
10. Passmark PerformanceTest 8.0
11. x264 Encoding
12. x265 Encoding
13. File Transfers
14. Virtual Machine Management
15. Conclusions
[/one_half_last]







2 thoughts on “VMware Fusion 8 Benchmarks vs. Fusion 7 and Boot Camp”