Check Your PC's Health With the Windows Reliability Monitor
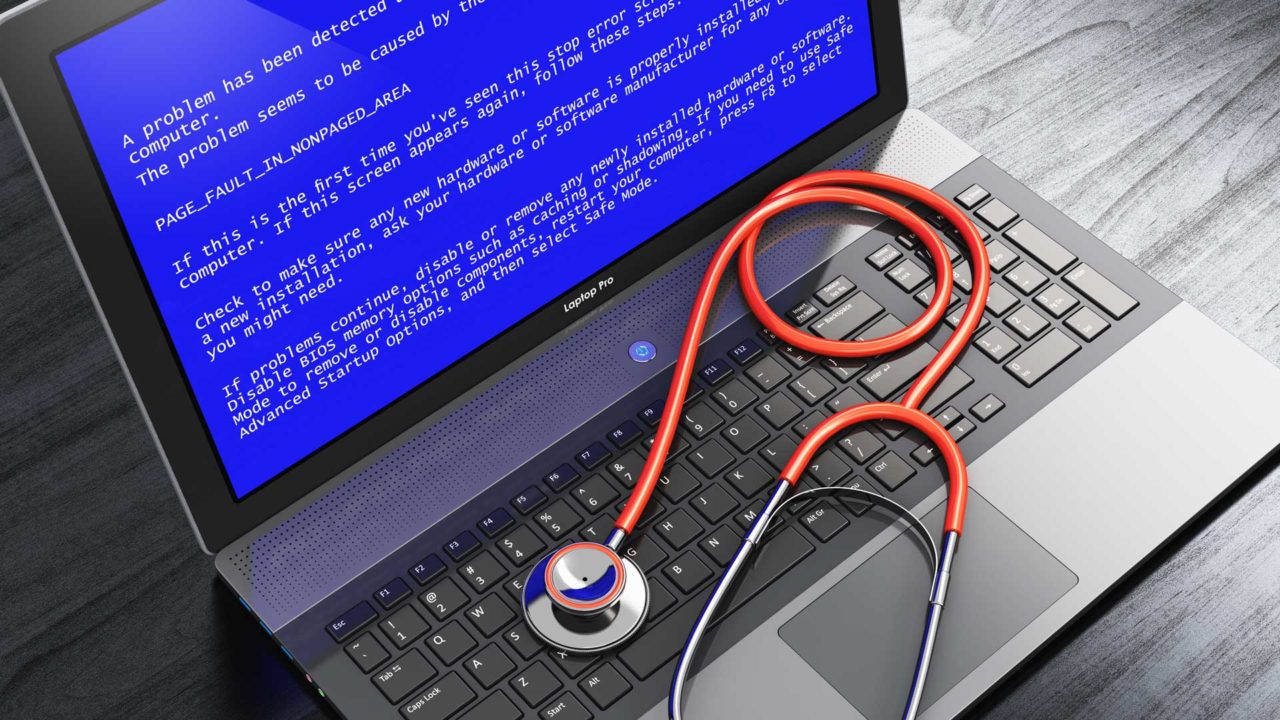
Is your Windows PC experiencing issues? Random restarts? Coming back to find it frozen? If so, one of the first places you’ll want to check is the Windows Reliability Monitor. This is a built-in utility that can provide valuable data on the important events and issues your PC may experience. Here’s how it works.
The screenshots and steps in this article cover Windows 10. However, the Windows Reliability Monitor is also available in earlier versions of Windows.
Launch the Windows Reliability Monitor
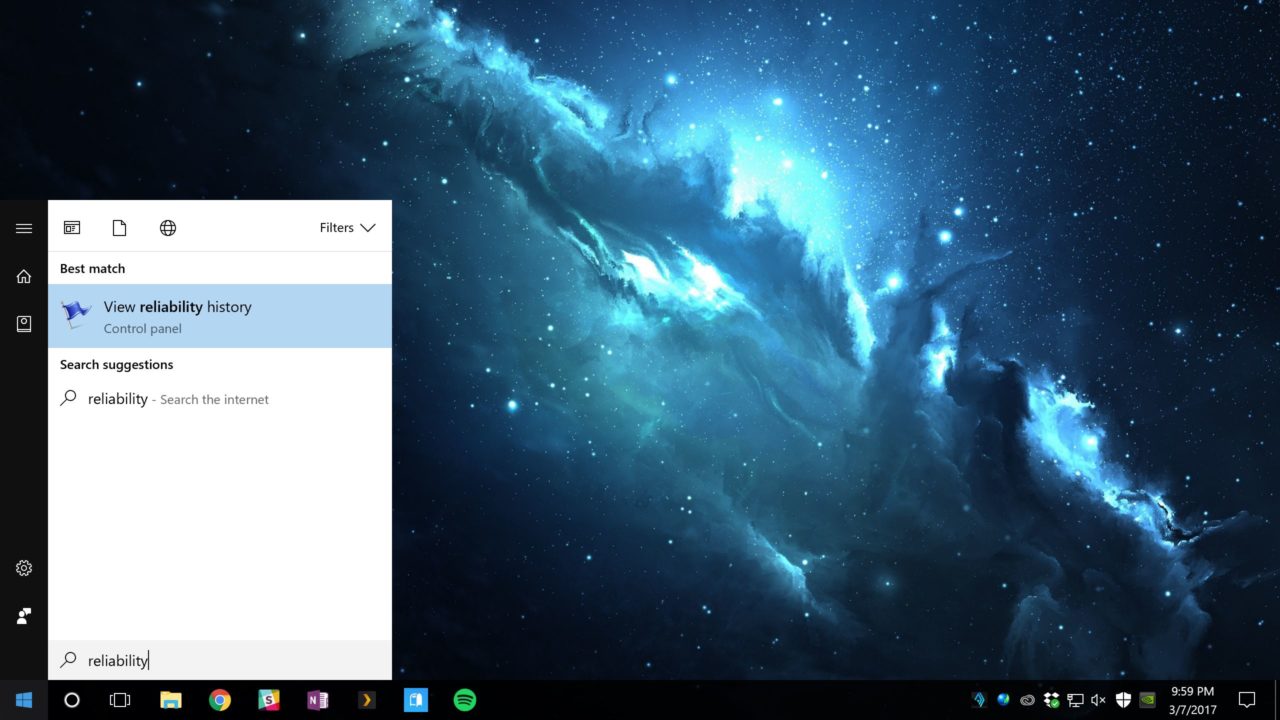
The quickest way to launch the Reliability Monitor is via the Start Menu. From your Windows 10 desktop, click the Start Button and search for the word reliability. Select the result labeled View Reliability History.
Alternatively, you can access the Reliability Monitor via the Control Panel by going to Control Panel > Security and Maintenance > Reliability Monitor.
How to Use the Windows Reliability Monitor
When the Windows Reliability Monitor launches, you’ll see a chart at the top arranged by date. The oldest entry starts on the left and the latest on the right. A blue line is plotted on the chart, ranking your system’s overall reliability on a scale from 1 to 10, with 10 being the best, or most reliable.
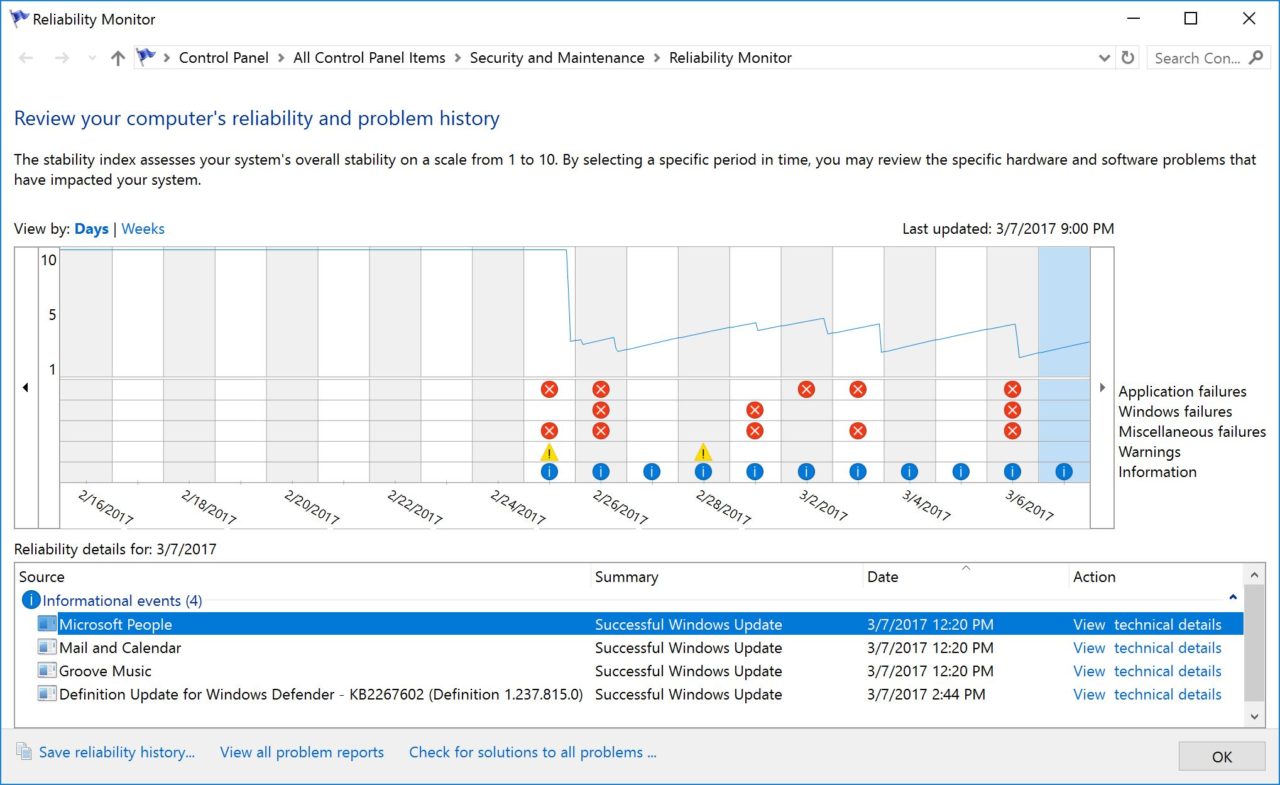
In the column for each day are a series of cells representing five categories that impact reliability. These are application failures, Windows failures, miscellaneous failures, warnings, and general information. If your PC encounters an issue or event in any one of these categories — such as an unexpected shutdown, application crash, or system freeze — you’ll see a mark in the corresponding category for the day the event occurred.
Troubleshooting with the Windows Reliability Monitor
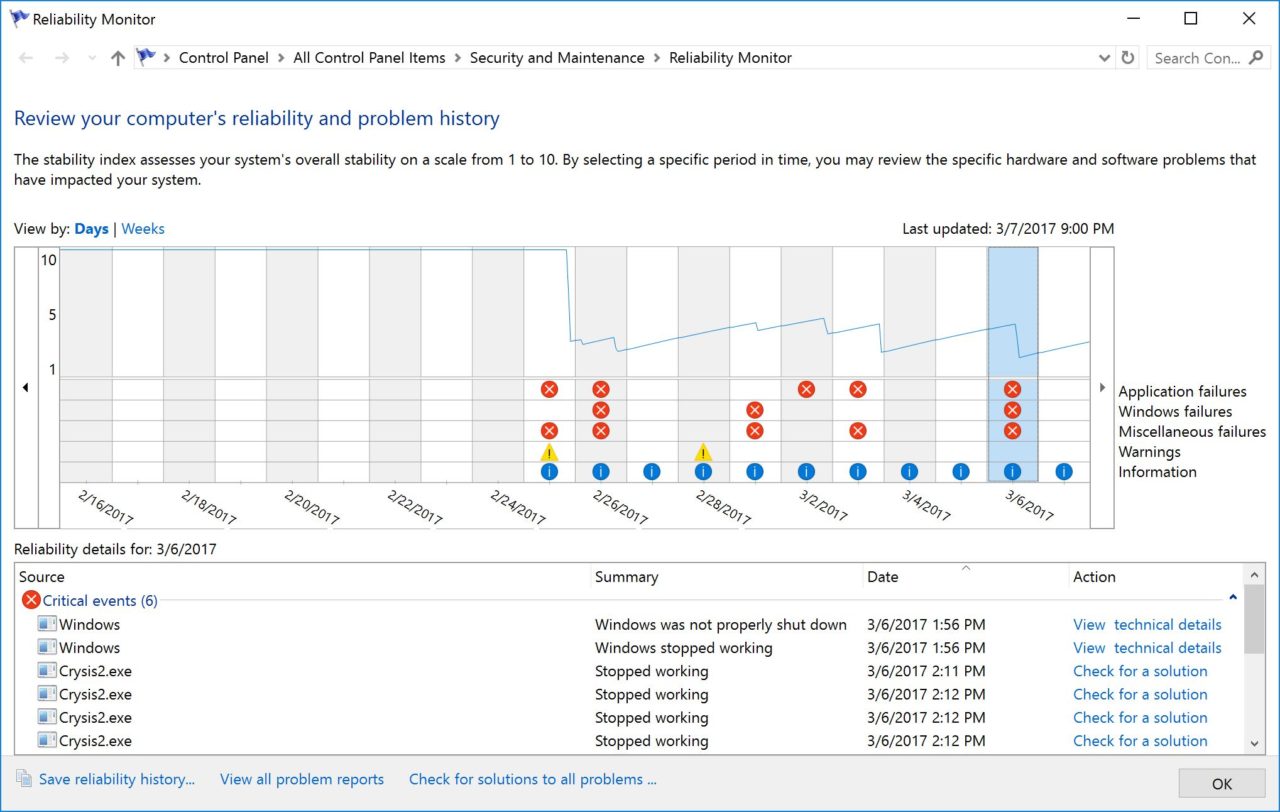
Clicking on a particular day will reveal the details of each category in the list at the bottom of the window. Based on our example screenshots, our Windows 10 PC ran perfectly during the first part of February. However, it seems to have encountered a series of problems in the last few weeks. Looking at the information for each day that had an issue, we can see that these errors correspond to our overclocking experiments, a task that frequently results in errors and unexpected restarts.
Therefore, we can safely dismiss these alerts because we know what caused them and we’ve now fixed the problem. If, however, we saw an application or system crash we weren’t expecting, we could click View technical details to learn more about what caused the issue and investigate further.
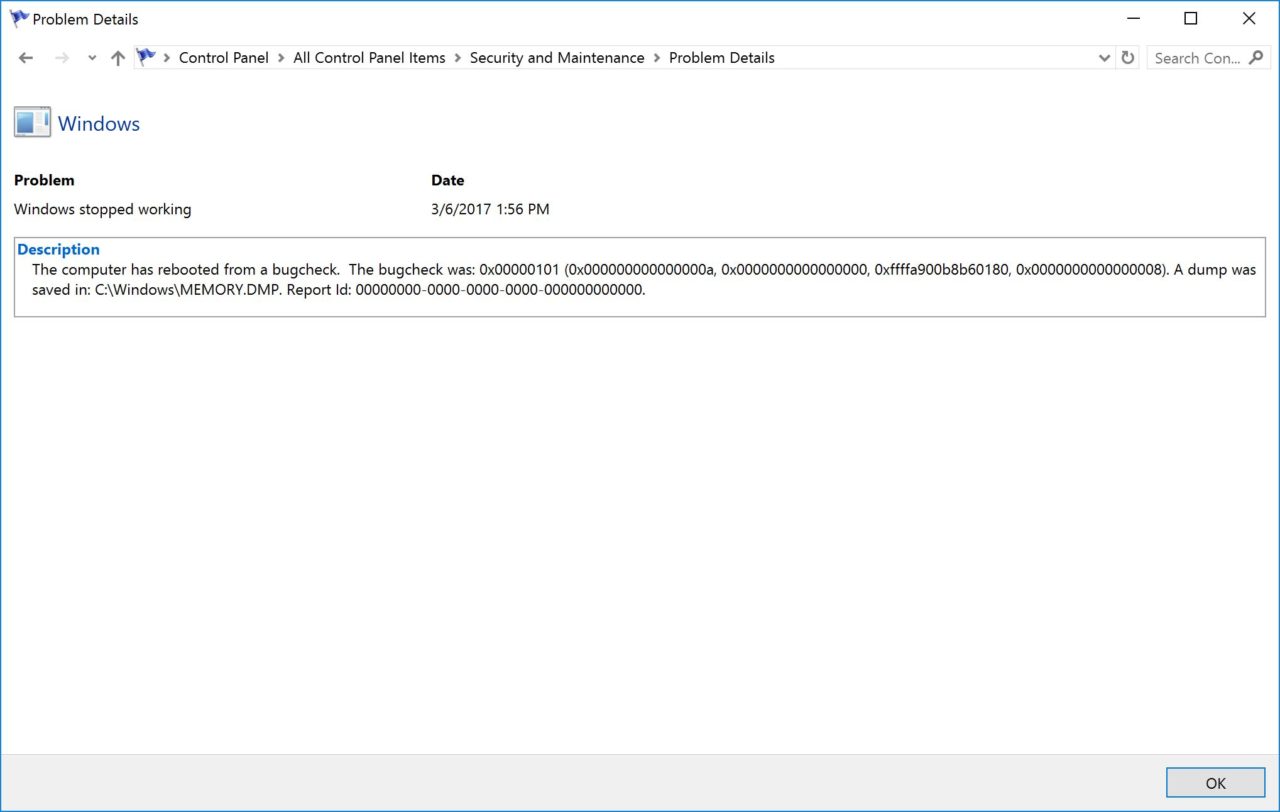
And that’s really where the Windows Reliability Monitor comes in handy. It’s generally not going to solve your problems for you (the “check for solution” option present next to some events almost never turns up anything helpful), but it’s very useful for narrowing down wonky behavior from your PC so that you can investigate and troubleshoot in a more focused manner. And sometimes, such as in the case of application crashes while you’re away, it may help you identify problems you didn’t even know you had.
If you find the information in a particular reliability report especially useful, you can also save your Windows reliability history as an XML file by clicking the Save reliability history button at the bottom-left of the Reliability Monitor window.


